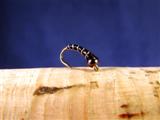
Fly of the Year For 2008
A great new feature added to Fish Swami in 2008 was the fishing log report summary page. Fish Swami graphs a handful of common statistics on one page to show how many fish were caught each month, what the top fish catching patterns were, etc. The summary page is updated as each fishing log report is added, and previous year’s summaries can also be viewed. I used the summary page this year to determine my fly of the year for 2008.
| Number Caught | Pattern |
|---|---|
| 175 | Zebra Midge |
| 128 | Pheasant Tail BH |
| 120 | Gold Ribbed Hare's Ear BH |
| 51 | CDC Loop-Tuft Emerger |
| 46 | Z-Wing Caddis |
| 43 | CDC Biot Thorax Dun |
| 26 | Elk Hair Caddis |
| 23 | California Leech |
| 21 | Chironocone |
| 20 | CDC Hackle Stacker |
The Zebra Midge blew away the competition this year with 175 fish caught. That total is up from 61 fish caught in 2007, and 2 in 2006. Last year’s top fly, the CDC Biot Thorax Sparkle Dun finished in 6th place with 43 fish caught. So why did the Zebra Midge catch so many more fish, and the CDC Biot Thorax Sparkle Dun so many fewer?
Winter Fishing
One of the big changes from 2007 to 2008 with regards to my fishing was that I fished during the winter more. I typically fish for trout in rivers, and the primary winter food source in rivers is midges. In 2007, I caught 129 fish during the wintry months of January, February, March, and December. In 2008, I caught 318 fish during those same months. Over the past few years, I’ve learned that good fishing can be had throughout the winter. As I’ve become a more adept angler at winter fishing, I’ve fished more with the zebra midge pattern because it realistically imitates the larval form of midges.
Pattern Consolidation
One interesting note when comparing my top flies of 2008 to those of 2007 is the percentage of fish they constitute of the year’s total. In 2008, my top 10 flies comprised nearly 76% of my yearly catch. However, my top 10 flies of 2007 comprised only 56% of my yearly catch. My theory is I have focused on fishing the same set of waters for a few years now, and as I’ve become a better angler on each of the waters, the number of flies I use has consolidated to a smaller, proven set. I no longer scramble through my fly boxes when I see fish rising because I have empirical knowledge as to what should work and why.
Zebra Midge Breakdown
For perusal and without much analysis, here are some interesting statistics related to my 2008 Zebra Midge catch totals. I compiled all of these stats using Fish Swami’s empirical analysis tool.
Top Zebra Midge Colors
| Number Caught | Pattern Color |
|---|---|
| 155 | Black |
| 18 | Rust |
| 1 | null |
| 1 | Red |
Top Fish Producing Months
| Number Caught | Month |
|---|---|
| 7 | February |
| 117 | March |
| 15 | April |
| 6 | May |
| 1 | June |
| 4 | October |
| 1 | November |
| 24 | December |
Top Fish Species Caught on Zebra Midges
| Number Caught | Fish Species |
|---|---|
| 129 | Rainbow Trout |
| 32 | Mountain Whitefish |
| 11 | Brown Trout |
| 3 | Gold Trout |
Average Time of Day
| Number Caught | Time |
|---|---|
| 175 | 11:49 AM to 6:25 PM |
Comments
DSFlyman
Hey, great empirical analysis


